First it is important to know El Niño and La Niña are part of a single climate phenomenon called ENSO, it has three states, or phases, it can be in. The two opposite phases, “El Niño” and “La Niña,” require certain changes in both the ocean and the atmosphere because ENSO is a coupled climate phenomenon. “Neutral” is in the middle of the continuum.
The effect that El Niño and La Niña have on both the Atlantic and Pacific hurricane seasons is worth exploring. The hurricane impacts of El Niño and its counterpart La Niña are like a see-saw between the Pacific and Atlantic oceans, strengthening hurricane activity in one region while weakening it in the other. Great graphics below explain these effects.
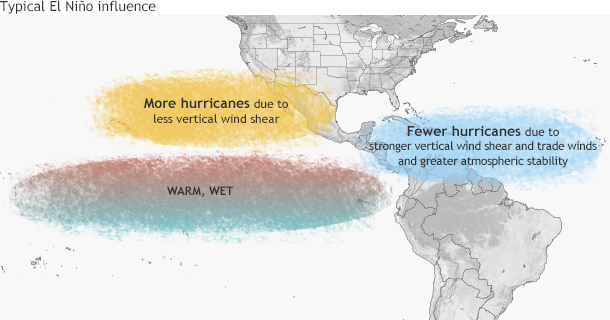 Typical influence of El Niño on Pacific and Atlantic seasonal hurricane activity. Map by NOAA Climate.gov, based on originals by Gerry Bell.
Simply put, El Niño favors stronger hurricane activity in the central and eastern Pacific basins, and suppresses it in the Atlantic basin (Figure 1). Conversely, La Niña suppresses hurricane activity in the central and eastern Pacific basins, and enhances it in the Atlantic basin (Figure 2).
Typical influence of El Niño on Pacific and Atlantic seasonal hurricane activity. Map by NOAA Climate.gov, based on originals by Gerry Bell.
Simply put, El Niño favors stronger hurricane activity in the central and eastern Pacific basins, and suppresses it in the Atlantic basin (Figure 1). Conversely, La Niña suppresses hurricane activity in the central and eastern Pacific basins, and enhances it in the Atlantic basin (Figure 2).
 Typical influence of La Niña on Pacific and Atlantic seasonal hurricane activity. Map by NOAA Climate.gov, based on originals by Gerry Bell.
These impacts are primarily caused by changes in the vertical wind shear, which refers to the change in wind speed and direction between roughly 5,000-35,000 ft. above the ground. Strong vertical wind shear can rip a developing hurricane apart, or even prevent it from forming.
ENSO perturbs tropical and subtropical atmospheric circulation
During El Niño, the area of tropical Pacific convection and its associated Hadley circulation expand eastward from the western Pacific, sometimes extending to the west coast of South America. (A tutorial on El Niño and La Niña can be found at the NOAA Climate Prediction Center website.) At the same time, the equatorial Walker circulation is weaker than average.
These conditions produce an anomalous upper-level, ridge-trough pattern in the subtropics, with an amplified ridge over the subtropical Pacific in the area north of the enhanced convection, and a downstream trough over the Caribbean Sea and western tropical Atlantic. Over the central and eastern Pacific, the enhanced subtropical ridge is associated with weaker upper-level winds and reduced vertical wind shear, which favors more hurricane activity.
Over the Atlantic basin, the amplified trough is associated with stronger upper-level westerly winds and stronger lower-level easterly trade winds, both of which increase the vertical wind shear and suppress hurricane activity. In addition to enhanced vertical wind shear, El Niño suppresses Atlantic hurricane activity by increasing the amount of sinking motion and increasing the atmospheric stability.
La Niña has opposite impacts across the Pacific and Atlantic basins. During La Niña, the area of tropical convection and its Hadley circulation is retracted westward to the western Pacific and Indonesia, and the equatorial Walker circulation is enhanced. Convection is typically absent across the eastern half of the equatorial Pacific.
In the upper atmosphere, these conditions produce an amplified trough over the subtropical Pacific in the area north of the suppressed convection, and a downstream ridge over the Caribbean Sea and western tropical Atlantic. Over the central and eastern subtropical Pacific, the enhanced trough is associated with stronger upper-level winds and stronger vertical wind shear, which suppress hurricane activity. Over the Atlantic basin, the anomalous upper-level ridge is associated with weaker upper- and lower- level winds, both of which reduce the vertical wind shear and increased hurricane activity. La Niña also favors increased Atlantic hurricane activity by decreasing the amount of sinking motion and decreasing the atmospheric stability.
Credit and more information found at: Climate.gov
More information on ENSO and other impacts of this phenomenon:
What is the El Niño–Southern Oscillation (ENSO) in a nutshell?
ENSO Status and Impacts
Typical influence of La Niña on Pacific and Atlantic seasonal hurricane activity. Map by NOAA Climate.gov, based on originals by Gerry Bell.
These impacts are primarily caused by changes in the vertical wind shear, which refers to the change in wind speed and direction between roughly 5,000-35,000 ft. above the ground. Strong vertical wind shear can rip a developing hurricane apart, or even prevent it from forming.
ENSO perturbs tropical and subtropical atmospheric circulation
During El Niño, the area of tropical Pacific convection and its associated Hadley circulation expand eastward from the western Pacific, sometimes extending to the west coast of South America. (A tutorial on El Niño and La Niña can be found at the NOAA Climate Prediction Center website.) At the same time, the equatorial Walker circulation is weaker than average.
These conditions produce an anomalous upper-level, ridge-trough pattern in the subtropics, with an amplified ridge over the subtropical Pacific in the area north of the enhanced convection, and a downstream trough over the Caribbean Sea and western tropical Atlantic. Over the central and eastern Pacific, the enhanced subtropical ridge is associated with weaker upper-level winds and reduced vertical wind shear, which favors more hurricane activity.
Over the Atlantic basin, the amplified trough is associated with stronger upper-level westerly winds and stronger lower-level easterly trade winds, both of which increase the vertical wind shear and suppress hurricane activity. In addition to enhanced vertical wind shear, El Niño suppresses Atlantic hurricane activity by increasing the amount of sinking motion and increasing the atmospheric stability.
La Niña has opposite impacts across the Pacific and Atlantic basins. During La Niña, the area of tropical convection and its Hadley circulation is retracted westward to the western Pacific and Indonesia, and the equatorial Walker circulation is enhanced. Convection is typically absent across the eastern half of the equatorial Pacific.
In the upper atmosphere, these conditions produce an amplified trough over the subtropical Pacific in the area north of the suppressed convection, and a downstream ridge over the Caribbean Sea and western tropical Atlantic. Over the central and eastern subtropical Pacific, the enhanced trough is associated with stronger upper-level winds and stronger vertical wind shear, which suppress hurricane activity. Over the Atlantic basin, the anomalous upper-level ridge is associated with weaker upper- and lower- level winds, both of which reduce the vertical wind shear and increased hurricane activity. La Niña also favors increased Atlantic hurricane activity by decreasing the amount of sinking motion and decreasing the atmospheric stability.
Credit and more information found at: Climate.gov
More information on ENSO and other impacts of this phenomenon:
What is the El Niño–Southern Oscillation (ENSO) in a nutshell?
ENSO Status and Impacts
Typical influence of El Niño on Pacific and Atlantic seasonal hurricane activity. Map by NOAA Climate.gov, based on originals by Gerry Bell.
Simply put, El Niño favors stronger hurricane activity in the central and eastern Pacific basins, and suppresses it in the Atlantic basin (Figure 1). Conversely, La Niña suppresses hurricane activity in the central and eastern Pacific basins, and enhances it in the Atlantic basin (Figure 2).
Typical influence of La Niña on Pacific and Atlantic seasonal hurricane activity. Map by NOAA Climate.gov, based on originals by Gerry Bell.
These impacts are primarily caused by changes in the vertical wind shear, which refers to the change in wind speed and direction between roughly 5,000-35,000 ft. above the ground. Strong vertical wind shear can rip a developing hurricane apart, or even prevent it from forming.
ENSO perturbs tropical and subtropical atmospheric circulation
During El Niño, the area of tropical Pacific convection and its associated Hadley circulation expand eastward from the western Pacific, sometimes extending to the west coast of South America. (A tutorial on El Niño and La Niña can be found at the NOAA Climate Prediction Center website.) At the same time, the equatorial Walker circulation is weaker than average.
These conditions produce an anomalous upper-level, ridge-trough pattern in the subtropics, with an amplified ridge over the subtropical Pacific in the area north of the enhanced convection, and a downstream trough over the Caribbean Sea and western tropical Atlantic. Over the central and eastern Pacific, the enhanced subtropical ridge is associated with weaker upper-level winds and reduced vertical wind shear, which favors more hurricane activity.
Over the Atlantic basin, the amplified trough is associated with stronger upper-level westerly winds and stronger lower-level easterly trade winds, both of which increase the vertical wind shear and suppress hurricane activity. In addition to enhanced vertical wind shear, El Niño suppresses Atlantic hurricane activity by increasing the amount of sinking motion and increasing the atmospheric stability.
La Niña has opposite impacts across the Pacific and Atlantic basins. During La Niña, the area of tropical convection and its Hadley circulation is retracted westward to the western Pacific and Indonesia, and the equatorial Walker circulation is enhanced. Convection is typically absent across the eastern half of the equatorial Pacific.
In the upper atmosphere, these conditions produce an amplified trough over the subtropical Pacific in the area north of the suppressed convection, and a downstream ridge over the Caribbean Sea and western tropical Atlantic. Over the central and eastern subtropical Pacific, the enhanced trough is associated with stronger upper-level winds and stronger vertical wind shear, which suppress hurricane activity. Over the Atlantic basin, the anomalous upper-level ridge is associated with weaker upper- and lower- level winds, both of which reduce the vertical wind shear and increased hurricane activity. La Niña also favors increased Atlantic hurricane activity by decreasing the amount of sinking motion and decreasing the atmospheric stability.
Credit and more information found at: Climate.gov
More information on ENSO and other impacts of this phenomenon:
What is the El Niño–Southern Oscillation (ENSO) in a nutshell?
ENSO Status and Impacts