
SUPPORT TRACK THE TROPICS
Over the last decade plus if you appreciate the information and tracking I provide during the season along with this website which donations help keep it running please consider a one time... recurring or yearly donation if you are able to help me out...
Venmo: @TrackTheTropicsLouisiana
Website: TrackTheTropics.com/DONATE
Venmo: @TrackTheTropicsLouisiana
Website: TrackTheTropics.com/DONATE
 The Saffir-Simpson Hurricane Wind Scale is a 1 to 5 categorization based on the hurricane's intensity at the indicated time. The maximum sustained surface wind speed (peak 1-minute wind at 33 feet/10 meters) is the determining factor in the scale.
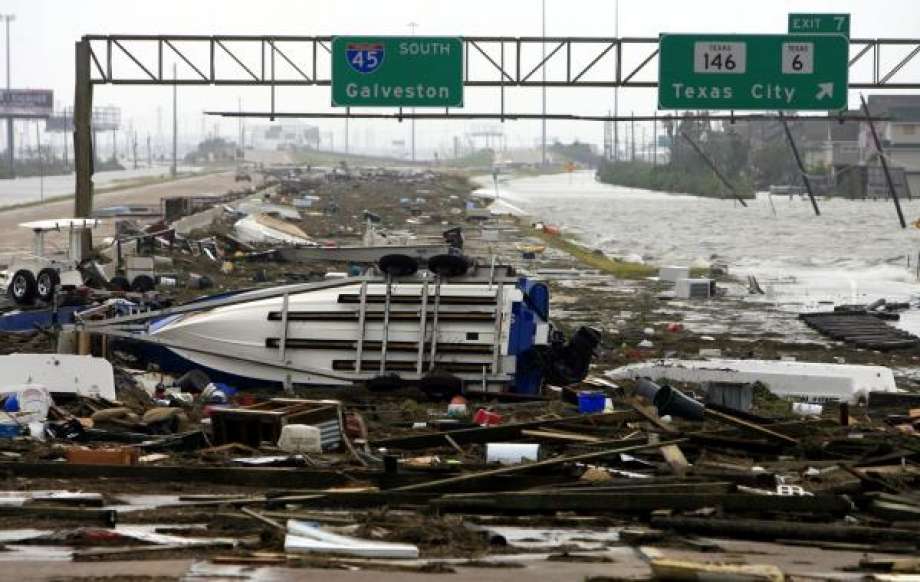
This scale provides examples of the type of damages and impacts in the United States associated with winds of the indicated intensity. In general, it shows damages rise by about a factor of four for every category increase.
However, this does not address the potential for such other hurricane-related impacts, such as storm surge, rainfall-induced floods, and tornadoes. When these additional factors are considered the rate of increase in damage is much higher.
When asked to rate potential damage from a category one hurricane to a category two or three storm most people's results are often linear in increasing damage. However, since the potential damage increase from category to category is logarithmic then small increases in wind strength can dramatically increase damage.
When the cost from hurricane related damages are normalized (normalization takes into account inflation, changes in population, and changes in wealth to arrive at a common level for comparison) the result shows an eighth-power increase (1) in damages from category to category.
What this means is the potential damage from a hurricane is 28 power. For example, a doubling of the wind speed from 75 mph (121 km/h) to 150 mph (241 km/h) is not a doubling or quadrupling of potential damage but a 256 times increase (2 x 2 x 2 x 2 x 2 x 2 x 2 x 2=256)
This is evident in that over 85% of all damages from hurricanes come from category three, four, and five storms, yet these storms make up only 24% of all landfalling storms (2). The following table shows the rate of increase for various wind speeds in a hurricane as compared to a minimal 75 mph (121 km/h) category one hurricane.
| Category | One | Two | Three | Four | Five | |||||||||||||||||||
| Wind Speed (mph) | 75 | 80 | 85 | 90 | 95 | 100 | 105 | 110 | 115 | 120 | 125 | 130 | 135 | 140 | 145 | 150 | 155 | 160 | 165 | 170 | 175 | 180 | 185 | 190 |
| Multiplier | 1x | 1.6x | 2.9x | 4.3x | 6.6x | 10x | 15x | 21x | 30x | 43x | 60x | 82x | 110x | 147x | 195x | 256x | 333x | 429x | 549x | 697x | 879x | 1101x | 1371x | 1696x |
| These values indicate increases in damage potential ABOVE damage that occurs with a 75 mph hurricane. | ||||||||||||||||||||||||
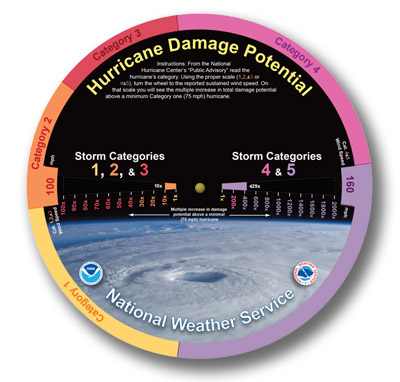 Hurricane Damage Potential
Wheel (pdf 980K)
Hurricane Damage Potential
Wheel (pdf 980K)
Remember, damage WILL occur with a 75 mph (121 km/h) hurricane. The multiplier values are the potential damage increases above what could occur with a 75 mph (121 km/h) storm. Note the rapid increase in potential damage just within each category. A 95 mph hurricane can produce nearly seven times the damage as a 75 mph (121 km/h) hurricane with just a 20 mph (32 km/h) increase in wind strength. A 10 mph (16 km/h) increase in wind speed, from 100 mph (161 km/h) to 110 mph (177 km/h), results in over doubling potential damage from 10-times that of a 75 mph (121 km/h) hurricane to 21-times.
What does this mean for you? Do not be lulled into complacency if you hear of a small increase in wind speed from a hurricane. These small increases directly lead to increasingly greater damage potential. Be wise and make preparations in advance to evacuate should law enforcement officers order evacuations.
Learning Lesson: Quadraphonic Wind
(1) Nordhaus, William D. "The Economics of Hurricanes in the United States" National Bureau of Economic Research (December 2006)
(2) R. A. Pielke, Jr. and colleagues. "Normalized Hurricane Damage in the United States: 1900–2005" Natural Hazard Review(2008)